Qubit
Fluorometric concentration assays are generally more accurate than spectrophotometric/UV-Vis absorbance (ie. Nandrop) measurements because they are less affected by common contaminants (ie. Proteins, RNA, or DNA).
This method is recommended for NGS library assessments and for any application that requires higher accuracy in concentration estimates than can be achieved with Nanodrop.
Request Form:
Qubit Request
Equipment Used: Qubit Flex Fluorometer, Qubit® 2.0 Fluorometer
|
SERVICE |
INTERNAL |
|
Qubit analysis |
$1.50 per sample, plus $3 for standards |
Nanodrop
The NanoDrop® ND-8000 can measure the concentration and quality of RNA, DNA, protein or labelled probes for microarray analysis. It is designed for the use of 1-2 ul samples. Cuvettes are not required. NanoDrop® ND-8000 can measure 8 samples simultaneously.
Subscription Form: https://www.uoguelph.ca/aac/facilities/genomics/documents/aac-geldoc-and-or-nanodrop-subscription
|
SERVICE |
INTERNAL |
|
Nanodrop |
$50 per year |
FAQs
What quantification methods do you have?
We offer both Qubit and NanoDrop for DNA and RNA quantification. Samples can be submitted to our lab for Qubit analysis.
We maintain a NanoDrop for client use based upon a subscription service (usually on a per lab group basis). The NanoDrop can be booked through BookitLab. For first time users please contact the facility to receive training.
Should I use the Qubit or the NanoDrop?
Qubit is more accurate and generally recommended for applications where a more precise concentration is needed such as NGS library preparation. NanoDrop can be useful for applications where a precise concentration is not necessarily required, or where absorbance ratios are desired (260/280 and 260/230).
What does good quality DNA/RNA on the NanoDrop look like?
When using NanoDrop, it is important to look at more than just your concentration. Contaminants in your sample can throw off accurate quantification. The image below shows an example of what a good curve on the NanoDrop should look like.
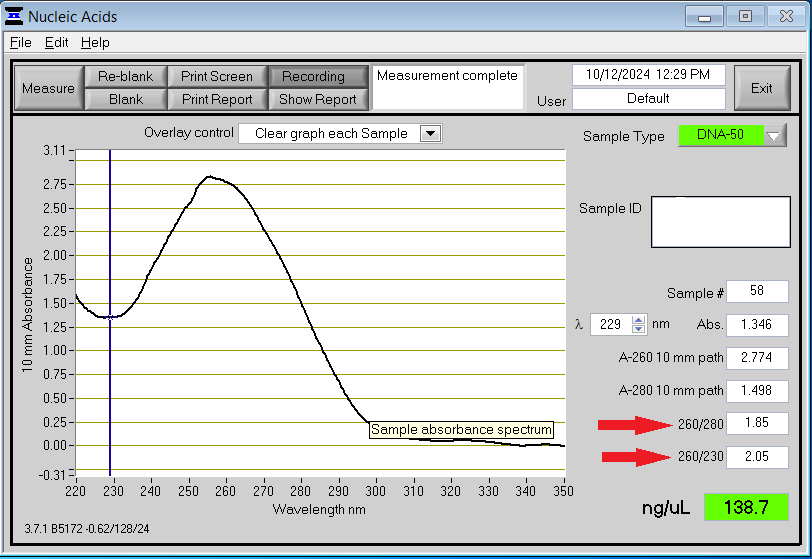
You will notice a strong peak at 260 nm, which is where genetic material is detected. It is important to look at the 260/280 and 260/230 ratios (red arrows). A good 260/280 ratio should be between 1.8 and 2.0 for DNA and between 2.0 and 2.2 for RNA. An ideal 260/230 ratio should be between 2.0 and 2.2. Below is a nanodrop result for a poor quality sample.
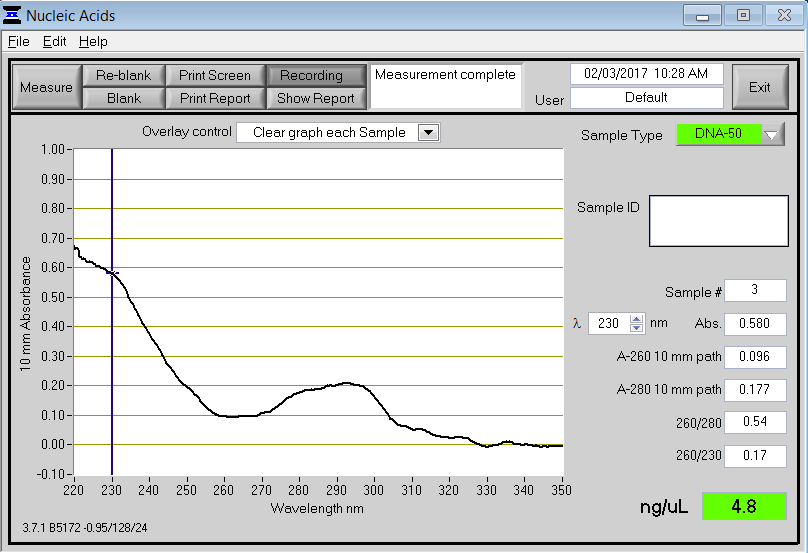
In this case, the curve looks much different without a peak at 260 nm. Both the 260/280 and 260/230 ratios are very low, indicating the presence of contaminants. A peak at 230 nm indicates the presence of organic compounds (e.g., Trizol and guanidine thiocyanate). A peak at or near 280 nm indicates contamination, typically from proteins or acidic phenol.